
14 Years on WordPress. Done in an Afternoon.
I've been wanting to move off WordPress and onto a static site for years. What always stopped me was the complexity. Here's how Claude Code knocked it out in an afternoon.
I've been wanting to move off WordPress and onto a static site for years. What always stopped me was the complexity. Here's how Claude Code knocked it out in an afternoon.

This week, Veeam made Generally Available Veeam Backup & Replication v12.3 ( Build 12.3.0.310 ), our third Veeam Data Platform release of the year building o...
Back in 2014, I was fortunate to be part of the launch of Cloud Connect Backup in Veeam Backup & Replication when at Zettagrid , a great moment in cloud data...

At VeeamON 2024, I had the pleasure of introducing our latest innovation: the next generation Veeam Intelligence integrated within VeeamONE. This isn’t just ...
This week, Veeam made Generally Available Veeam Backup & Replication v12.2 ( Build 12.2.0.334 ), continuing the innovation of our core platform with a signif...

In today’s tech world, keeping up with the latest trends is more important than ever. On last week’s Veeam Industry Insights, myself and Leah Troscianecki to...
In the latest episode of the Great Things with Great Tech podcast, we delve into the challenges of IT management in today's fragmented channel. We explore ho...
The data analytics landscape has seen a remarkable transformation with the emergence of open-source platforms. Among these, Apache Iceberg and Starburst stan...
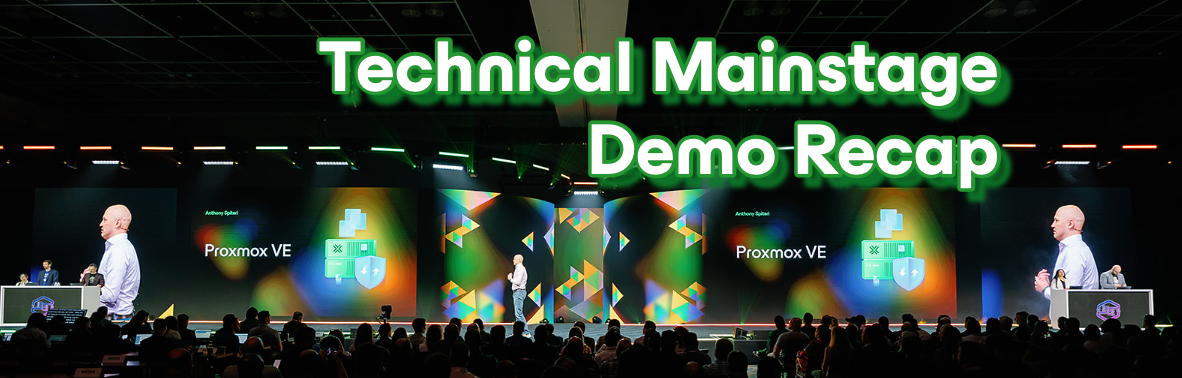
VeeamON 2024 has wrapped up, and what a brilliant event it was! A lot of great feedback overall, and a lot of positive reaction to the demo's that we showed ...

As we move deeper into the era of Generative AI, the not so known corners of the internet, particularly the dark web, are becoming a hotbed for sophisticated...
I haven't done one of these blog posts for a while, but in the lead up to VeeamON in a couple weeks, as we look ahead to what's coming we haven't taken our e...
The cloud computing landscape has witnessed a remarkable transformation with the emergence of open-source platforms. Among these, Apache CloudStack stands ou...