First Look: CloudPhysics - Datastore Contention Card
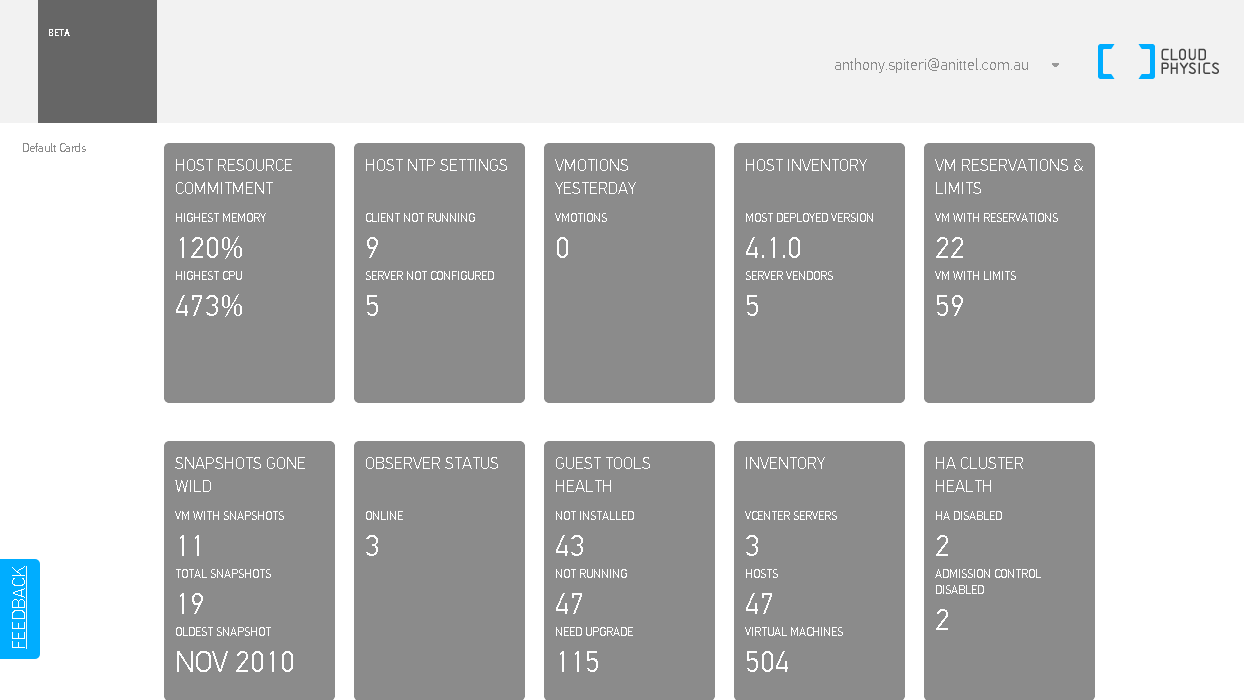
I first came across CloudPhysics just before VMWorld 2012. For a general overview, go (https://www.cloudphysics.com/about.html): I am a massive fan of analytics and trend metrics and I use a number of systems to gain a wide overview of the performance and monitoring of our Hosting and Cloud Platform…as well as extending out to client systems. I love the deep/complex analytics of VMware Operations Manager but sometimes I feel a sense of being overwhelmed with the sheer amount of data presented by the default views of vCOPs and working with the Custom Dashboards can be a frustrating exercise if you don’t have a heap of time and patience. This is where I have found CloudPhysics comes into it’s own…via it’s brilliant presentation of things that matter. I’m not going to go through the setup and config, but in a nutshell…from the site, register, login, download and deploy the VMware Probe Appliance, give it an IP and enter in your email address as it relates to your CloudPhysics login. It’s one probe per vCenter, but you can deploy multiple probes to multiple vCenters and links them back under the same username and CloudPhysics App. When you log in, you are presented with the home screen below:
!(/images/2013/01/cloudphysics.png)
From relatively humble and basic default cards released around the VMWorld launch the team has been adding more complex and useful cards. HA Cluster Health and SnapShots Gone Wild are my personal favourites and offer a view into key areas of vSphere management. What’s also great about these cards is that they offer external jump links to VMware KB’s and offer basic information about subject matter. The organisation and presentation of the data pulled by the probe is simple yet effective in allowing you to get an understanding of how your environments are performing and which areas are under stress.
Released today was the DataStore Contention Card which looks at the performance of VMFS Datastores in your environment. The Default view selects the DataStore that needs the most attention. In my case I was surprised to see the Datastore below exhibit combined read/write latency that was off the chart!
!(/images/2013/01/cloudphysics_2.png)
The interface allows you to select a block of time at any level and see which VM may be contributing the most to the Performance Metric selected. Those metrics are shown below and include Latency, Outstanding I/O’s, IOPS and Bandwidth. You also have the ability to Filter the view by vCenter, Datastore Cluster and Datastore.
!(/images/2013/01/cloudphysics_3.png)
The screen grabs don’t do the CloudPhysic’s Web Application interface justice so head over the site and download the probe to get started. It must be said that the product is only in BETA so use at your own risk, but I’ve had no issues with the Probe VM who’s specs are 2vCPU, 4GB of RAM and 16GB of storage.
1 Commentarchived