Released - Kasten K10 4.5 for Kubernetes Backup
Releases are different in the Cloud Native world… unlike more traditional software vendors that release less often with more fixes and features, in this world the idea is to release fast to fix issues and add features quicker. Kasten by Veeam is no different to this, and today released K10 (https://docs.kasten.io/latest/releasenotes.html#relnotes-4-5-0). Though there have been a consistent flow (12 to be exact) of point releases since the 4.0.x release since April, this is the start of the 4.5.x release cadence. Almost to prove how fast things are released in this world, as I started to finish up this post, (https://docs.kasten.io/latest/releasenotes.html#relnotes-4-5-1) was posted.
New Features
v4.5.0 has some significant features and modern application platform supportability was added to the product.
With this latest release of Kasten K10, we focused on delivering an improved out-of-the-box experience, expanding edge capabilities, and broadening ecosystem support for data services and partner technologies. On the improved out-of-the-box experience front, we added built-in support for monitoring and alerting to help our customers quickly identify issues in their Kasten K10 deployments, get notified of those issues, and fix them as quickly as possible. We also added reporting capabilities that lets you access reports through our GUI and through native Kubernetes tooling such as kubectl or the Kubernetes API.
Grafana Integration
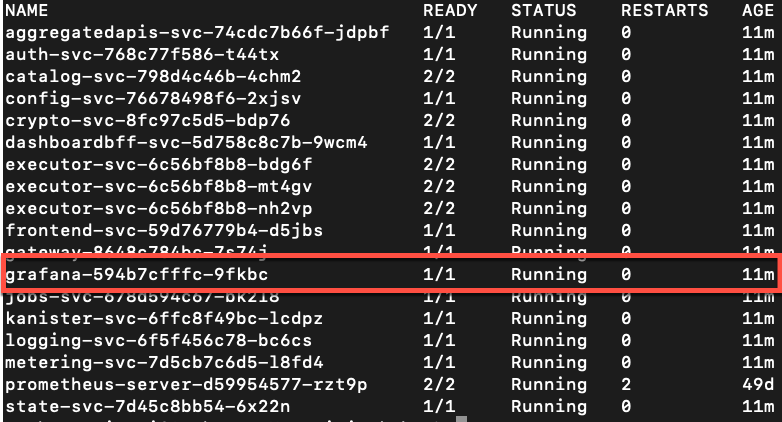
A new dashboard in Grafana lets users monitor K10 actions, policy runs and storage consumption. Alerts can be created using Grafana’s dashboard based on K10 metrics. Those with a keen eye would notice that the number of PODs in the kasten-io namespace increases in number after the 4.5 upgrade has completed.
The different makeup now includes a Grafana POD.
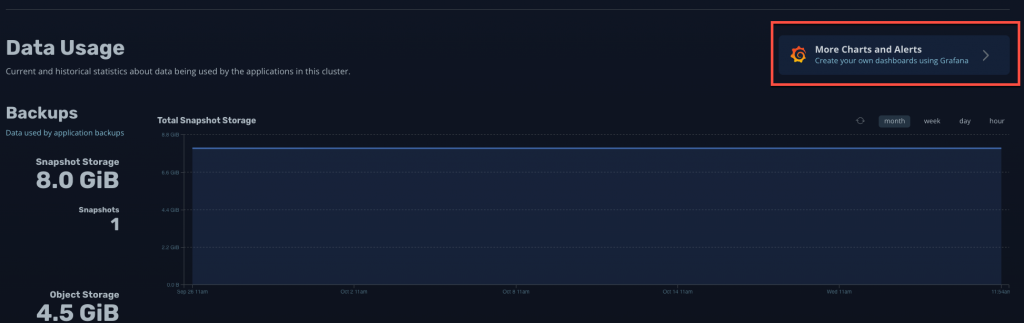
 To access this new feature you can go to Dashboards and click on More Charts and Alerts, which also has the Grafana logo next to it.
 From there a new window is launched and you have a Grafana interface with a preconfigured dashboard. Mine looks pretty bare as this isn’t an active production Kubernetes cluster.
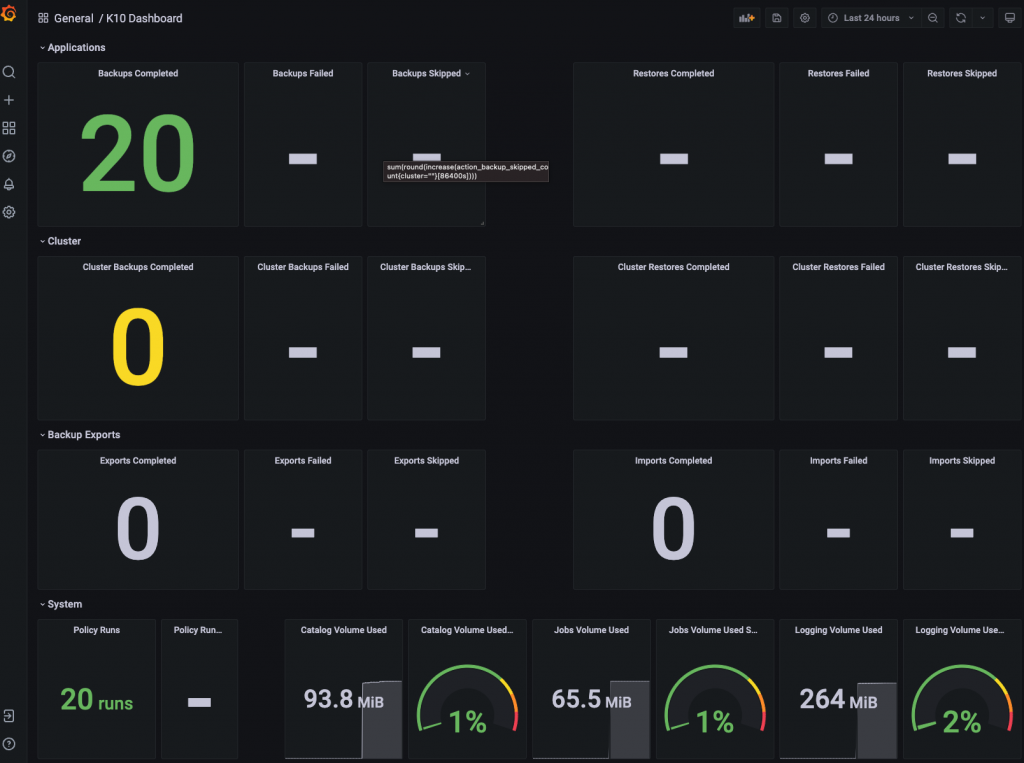 From here you can configure your own dashboards with more info found in the Monitoring documentation on the Kasten Docs page.
Scheduled Reports on the Dashboard
The more info the better, and K10 4.5 introduces reporting to add regular insights into key performance and operational states of the system. When enabled, information is collected from the system turning that into generated reports that include information such as license status, actions run, configured policies and profiles, compliance information, and service information.
To enabling K10 Reports, there is a toggle on the Dashboards page.
 When enabled, a policy is created to manage the generation of reports. Reports are generated according to the policy and then stored in the cluster. The policy is also be visible on the policies page.
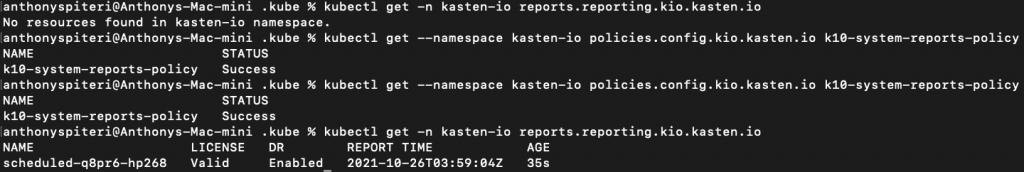
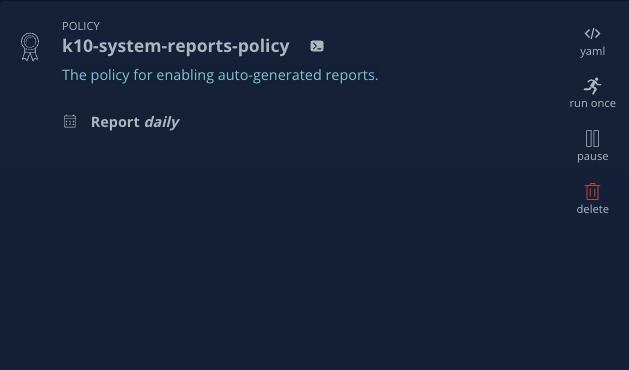 From the command line, you can also view the status of the reports and if you desire, also get them printed on screen…
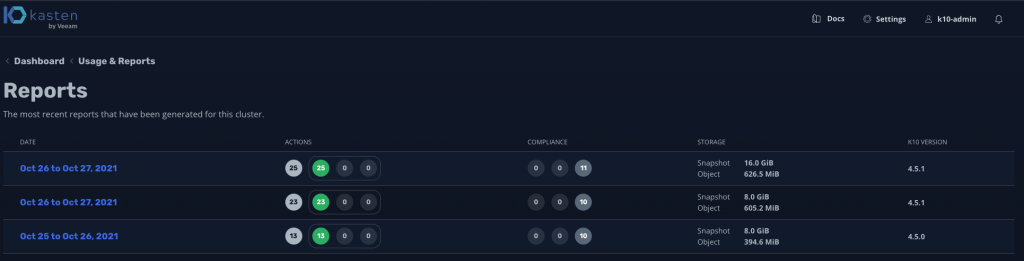
 Getting back to the Web UI, with the reports run, you can view a summary of all the reports that have run and it provides a really good insight into what’s been happening on your K10 instance.
Rest of the Updates
- The immutable backups feature is now available by default.
- Kasten K10 now support K3s as well as EKS-Anywhere.
- Added support for K8ssandra backup and restore with K10.
- The dashboard now supports adding blueprints to application workloads.
For a deeper look at what’s new in K10 4.5, head to the Official Release blog to find out more about the new features and enhancements listed above.
Get Kasten K10:
To get started with K10, you can click (https://docs.kasten.io/latest/install/index.html) to get the low down on installing K10, or watch a video I created going through the online lab (https://www.youtube.com/watch?v=4KudG60rXGo&t=266s) or directly below. https://www.youtube.com/watch?v=4KudG60rXGo
1 Commentarchived